Asymmetry in Product Features: Use of the Kano Method

Research in psychology and practical experience in marketing research suggest that product features are not always perceived to be symmetric. That is, there isn’t always a smoothly increasing (or decreasing) relationship between product feature performance and its effect on the consumer.
A good way to understand this may be to look at a feature that is linear, say, gas mileage for a car. Generally as gas mileage increases, satisfaction with the car increases proportionately, and vice versa. Now consider something like heated seats in a non-luxury car. If it is not available it is unlikely to cause any dissatisfaction, while its presence can be a pleasant surprise. Such a feature is often referred to as a satisfier. The opposite of that is a dissatisfier (i.e.) one whose absence causes dissatisfaction, but whose presence does not increase satisfaction. An example of such a feature may be keyless entry in a car. Therefore, one could say that these types of features are asymmetric since their impact on satisfaction and dissatisfaction is not equal. [Please refer to the article Asymmetry Analysis for a more complete explanation of this topic].
The focus of asymmetry analysis is to identify satisfiers and dissatisfiers from among the features of a product. By definition, satisfaction with a product is an experience and can only be measured when a consumer has used the product. What do we do when such features need to be identified before the product is used (i.e.) in the development of a new product? The Kano method provides similar results and can therefore be very useful in the new product development process.
Table 1
| Asymmetry Analysis | Kano | Example |
|---|---|---|
| Symmetric | One-dimensional (O) | Gas mileage |
| Satisfier | Attractive (A) | Heater seats |
| Dissatisfier | Must-have (M) | Keyless entry |
| Non-driver | Indifferent (I) | Chrome wheels |
The Kano method is named after Professor Noriaki Kano from Japan and is based on his work on product quality and, in particular, customer-defined quality. While its terminology and approach are different, its essence is very similar to that of asymmetry analysis. In the Kano method, features are seen as belonging to one of several categories. For our purpose the relevant categories are One-Dimensional, Must-Have (also called Must-Be), Attractive and Indifferent. Table 1 shows the relevant categories in each system and their similarities.
While the two methods are clearly similar, they differ in how the results are obtained. In asymmetry analysis, satisfaction data are analyzed in a regression framework to identify satisfiers and dissatisfiers. In the Kano method, the questions are asked in such a way that respondent answers would indicate what category a feature should fall into. No multivariate analysis is used. A feature is essentially seen as working (functional) or not working (dysfunctional). (See Figure 1)
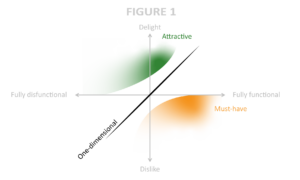
Respondents are asked to indicate how they would feel if the feature were functional and how they would feel if it were dysfunctional. The response scale has five categories ranging from Delight to Dislike. Given that the original scale was in Japanese, the exact translation of the scale is sometimes confusing. Therefore, modified versions of the original scale have often been used. For the functional and the dysfunctional aspects of each feature, the respondents indicate their liking. Compiling the results in a Kano evaluation table provides the classification of features.
The Kano table is a five-by-five matrix between the two scales and one way of interpreting the categories is shown in Table 2.
Table 2
| Dysfunctional (Not working) | ||||||
|---|---|---|---|---|---|---|
| Delighted | Expected | Neutral | Live with it | Dislike it | ||
| Functional (Working) |
Delighted | A | A | A | O | |
| Expected | I | I/O | M | |||
| Neutral | I | I | M | |||
| Live with it | M | |||||
| Dislike it | ||||||
Responses that fall into the empty cells are questionable. The categorization of the other cells is not always clear cut, but the general pattern is evident. When a respondent likes the functional aspect of a feature and does not have strong feelings about the dysfunctional aspect, it is an Attractive feature. In the opposite case it is generally a Must-Have feature. When they generally don’t have strong feelings on either side, its an Indifferent feature.
Each respondent’s answers are thus categorized and the proportion of responses that fall into each category are summarized. Given that there are inherent differences between people, the same feature might be looked at differently by different people. This may indicate that there are some preference-based segments in the market.
An Example
A Kano analysis was conducted in the healthcare market using a web panel. Respondents indicated their preference for the features of a healthcare insurance product. Proportions of respondents who fall into each category are shown in Table 3.
Table 3
| Features | Kano Classifications | |||
|---|---|---|---|---|
| Must-Have | Attractive | One-Dimensional | Indifferent | |
| Accurate/Timely Claims | 61 | 9 | 23 | 8 |
| Extensive Doctor List | 53 | 11 | 22 | 14 |
| Extensive Hospital List | 45 | 15 | 21 | 19 |
| Dental coverage | 31 | 28 | 30 | 11 |
| Vision coverage | 27 | 27 | 32 | 13 |
| No referrals required | 24 | 36 | 21 | 19 |
| Chiropractic services | 18 | 27 | 14 | 40 |
| Mail order RX | 16 | 21 | 8 | 55 |
| Discount on wellness | 9 | 38 | 11 | 42 |
All numbers are percentages
Percentages should be read across and add up to 100% horizontally. For example, Accurate/Timely Claims is classified as a Must-Have feature by 61% of respondents, as an Attractive feature by 9%, as a One-Dimensional feature by 23% and as an Indifferent feature by 8%. There is more of a consensus on some features than others. Features such as Extensive Doctor List and Extensive Hospital List, as well as Claims payments, are classified by many people as Must-Have’s or One –Dimensional. But there are clearly segments in the market when it comes to features such as Dental or Vision coverage. It would make sense for the health insurance company to study these segments more closely to see if they are worthy of pursuing by offering specific plans or add-ons.
In Conclusion
Kano analysis works better with features that are either present or absent. Features on a continuum can be included if phrased appropriately. When trying to build a new product, it generally makes sense to start with Must-Have features, add One-Dimensional features and then add Attractive features if possible. Of course, one must understand if there are economically viable segments in the market that place a premium on Attractive features. In such cases variations of the product could be used to target them.

My primary job is overseeing research and analytical activities at TRC. I’m usually involved in the design and statistical analysis of most projects we do. I have spent years working with data and in my time here I have worked with more companies than I can recall, many of whom are household names.
Theory and practice of marketing research are similar yet distinct entities and their intersection interests me. Immersion in one enriches the other and I pursue that by interacting closely with academia.
For several years I taught marketing research to MBA students at Columbia University, as an Adjunct Associate Professor. Prior to that, I was a Knowledge Partner to the Yale Center for Customer Insight helping translate academic research for practitioners.
For many years I have organized conferences with a mix of academic and practitioner speakers and have published several research articles. I also do regular guest lectures at business schools in Wharton and Columbia to help students understand the practical issues in research.
If you want to talk research, feel free to email me. Or, if you prefer to chat about food, workouts or sports/analytics, that works too.
Education: Ph.D. in Marketing, SUNY Buffalo; B.E. – Electronics and Communications Engineering, Anna University, India
TRC Clock: Since 1995
Contact Rajan
Follow Rajan on LinkedIn
You can read some of my research thoughts at TRC Blog.